 Flowchart and pseudocode are the ways to represent the control flow through the statements of the program, algorithm, process, etc. The significant difference between the flowchart and pseudocode is how they represent the control flow.
The flowchart is a graphical representation of an algorithm. However, the pseudocode is the text-based representation of the algorithm. Well, we can use these concepts together to design software, or we can even use them independently.
In this section, we will discuss both of these concepts in detail. We will also explore all the differences between them with the help of a comparison chart. So, let’s start.
Content: Flowchart Vs Pseudocode
Comparison Chart
| Basis for Comparison | Flowchart | Pseudocode |
|---|---|---|
| Representation | Pictorial representation of an algorithm | Text-based representation of an algorithm |
| Detailing | Adding too much detail can make the flowchart complex | Pseudocode is flexible for adding details |
| Modification | Its structure resists modification | It is easy to modify |
| Structure | There is a list of specific elements used to create a flowchart | There are no standards or tools required to create the pseudocode |
| Understanding | Easy to understand | Difficult to understand |
| Beneficial | Flowcharts are beneficial for smaller codes | Pseudocodes are beneficial for larger programming codes |
What is Flowchart?
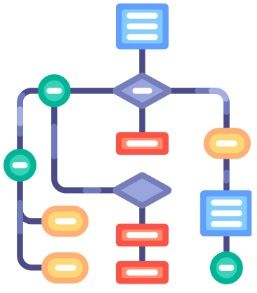
A flowchart provides the graphical representation of a program, a system, an algorithm or a process. It represents the set of sequential steps that a program, system, algorithm or process must follow to obtain the desired output. Usually, we use flowcharts in the field of computer programming. However, it helps programmers and the ones with a non-programming background to understand the control flow of any process.

As we know, visuals express better than words, which became the reason behind the popularity of the flowchart. The flowcharts are even helpful in improving the case study or plan behind designing any algorithm.
A well-created flowchart makes the documentation even easier. This is why people from different fields use the flowchart to make understanding easier.
Symbols of Flowchart
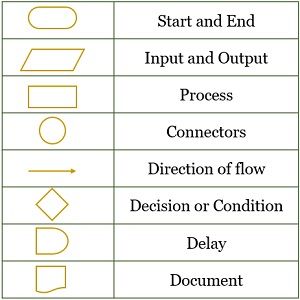
To create a flowchart, one needs to follow a set of standards. We know that we have different types of expressions in an algorithm or a program. Like, there is computation, condition, jump, display instruction, etc. So, to represent different types of expression, the flowchart has different types of symbols.
The table below shows you different symbols we can use in flowcharts and their significance.
Types of Flowchart
Process Flowchart
The process flowchart is the most popular flowchart. Its flexibility allows users to apply it to almost anything like business planning, a machine or a system, programming, etc.
The process flowchart helps its readers understand how the particular process will work and how things will get done throughout the whole process.
Workflow Flowchart
The workflow flowchart helps readers understand the flow of information within the system. It effectively shows how a process would work.
It represents business processes such as, how each process will complete, the role of employees at each step, in what sequence the process will be completed, etc.
Swimlane Flowchart
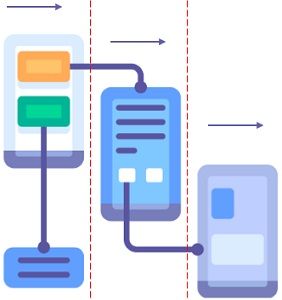
Swimlane flowcharts are very helpful in showing the interaction between different processes. This flowchart shows the flow of information through separate processes.

The Swimlane flowchart is divided into categories so that each department knows its role in the process. Thus, the Swimlane flowchart makes each department’s responsibility clearer in the process.
Data Flowchart
The data flowchart represents how the data or information move in and out of the system. It also represents how the data is processed inside the system.
Example of Flowchart
The flow chart below first reads the two numbers and compares them. If the first number is greater, then subtraction is performed; if the condition is not true, then addition is performed.
What is Pseudocode?
The pseudocode is a way to represent the working of an algorithm, process, or program in plain textual English language. Pseudocode helps its creator express the steps they have figured out to resolve a problem for which the code will be written later.
Usually, we use pseudocode in the field of computer programming. It helps programmers to communicate their ideas with their clients who are from the non-programming field.

While creating the pseudocode, the creator does not have to worry about the syntactic error because it is false code written in a simple English language.
Although you might be thinking, why should we write the pseudocode and not directly jump to coding?
Pseudocode makes things a lot easier. With pseudocode, the programmer beforehand knows what they have to code. Ultimately the programmer has to convert the English statements in pseudocode into the actual code with the syntax of the programming language they are using for coding.
How to Write Pseudocode?
As such, there are no standards for writing pseudocode. The creator can use their way of presenting the statements of pseudocode. This is because the pseudocode is not written for a computer to read. It is for the understanding of the relevant people like programmers, clients, team members, managers, etc.
Although we said there are no such standards to write pseudocode, there are still some simple rules that one must follow to create a readable pseudocode.
- The initial letters of every word in the statement must be capital.
- Each pseudocode statement must specify a single operation to the computer.
- The multi-line section, such as the set of statements that must be performed when a certain condition satisfies, or when a loop ends, etc., should be terminated with the END keyword.
- Pseudocode must not be abstract; it must be elaborative and explain all the steps required to get the desired output.
- The creator must use proper naming conventions as it helps the programmer to follow the pseudocode while coding.
- The statements in the pseudocode must be independent of any programming language so that it will be easy for a programmer to code it in any programming language.
- The pseudocode must be simple, self-explanatory and readable.
Examples of Pseudocode
To explain pseudocode with the help of an example, let us use the same example that we used for explaining the flow chart:
If Number1 > Number2
Result = Number1 – Number 2
Else
Result = Number1 + Number2
EndIf
Write Result
The pseudocode above adds or subtracts two numbers depending on a particular condition.
Key Differences Between Flowchart and Pseudocode
- The flow chart is an algorithm’s pictorial or graphical representation. However, the pseudocode is a textual representation of an algorithm. We write pseudocode statements in English, and each statement represents an instruction.
- Adding too much of details to the flowchart makes it complex. However, pseudocode is quite flexible for adding details, as it doesn’t increase its complexity.
- Once created, it isn’t easy to modify the flowchart. On the other hand, modifications are easy in pseudocode.
- To create a flowchart, we have to list specific elements such as a diamond box for decision-making, a rounded box for a start and stop, arrows to show the flow of control, etc. However, there are no standards to create pseudocode; even if there are any, they vary from company to company.
- Flowcharts are comparatively easy to understand than pseudocode. Because pseudocode has the narrative presentation of the algorithm or program, which makes things complicated to understand. However, flowcharts can show the control flow through the code, making it easy to understand.
- The flowchart is beneficial for representing small-size algorithms or programs, as it becomes difficult to show the control flow in the flowchart for the large-size algorithm. On the contrary, the pseudocode benefits both small and large-size algorithms.
Conclusion
The flowchart is the conventional tool that we use to understand the algorithm as it would graphically show its control flow. Unfortunately, flowcharts lacked to reflect the concept of structured programming. Later pseudocodes were introduced, effectively reflecting the concept of structured programming.
Liana says
thanks for info