 Linear and Logistic regression are the most basic form of regression which are commonly used. The essential difference between these two is that Logistic regression is used when the dependent variable is binary in nature. In contrast, Linear regression is used when the dependent variable is continuous and nature of the regression line is linear.
Regression is a technique used to predict the value of a response (dependent) variables, from one or more predictor (independent) variables, where the variable are numeric. There are various forms of regression such as linear, multiple, logistic, polynomial, non-parametric, etc.
Content: Linear Regression Vs Logistic Regression
Comparison Chart
| Basis for comparison | Linear Regression | Logistic Regression |
|---|---|---|
| Basic | The data is modelled using a straight line. | The probability of some obtained event is represented as a linear function of a combination of predictor variables. |
| Linear relationship between dependent and independent variables | Is required | Not required |
| The independent variable | Could be correlated with each other. (Specially in multiple linear regression) | Should not be correlated with each other (no multicollinearity exist). |
Definition of Linear Regression
The linear regression technique involves the continuous dependent variable and the independent variables can be continuous or discrete. By using best fit straight line linear regression sets up a relationship between dependent variable (Y) and one or more independent variables (X). In other words, there exist a linear relationship between independent and dependent variables.
The difference between linear and multiple linear regression is that the linear regression contains only one independent variable while multiple regression contains more than one independent variables. The best fit line in linear regression is obtained through least square method.
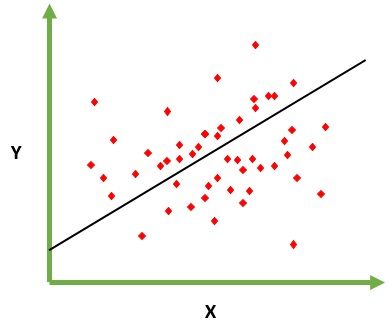
The following equation is used to represent a linear regression model: Where b0 is the intercept, b1 is the slope of the line and e is the error. Here Y is dependent variable and X is an independent variable.
The following graph can be used to show the linear regression model.
Definition of Logistic Regression
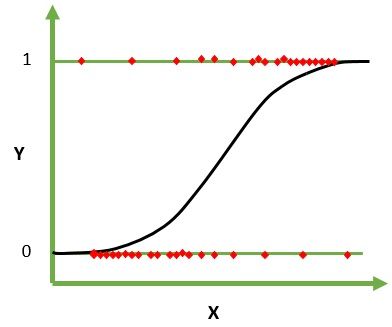
The logistic regression technique involves dependent variable which can be represented in the binary (0 or 1, true or false, yes or no) values, means that the outcome could only be in either one form of two. For example, it can be utilized when we need to find the probability of successful or fail event. Here, the same formula is used with the additional sigmoid function, and the value of Y ranges from 0 to 1.
Logistic regression equation : By putting Y in Sigmoid function, we get the following result.

The following graph can be used to show the logistic regression model.
As we are working here with a binomial distribution (dependent variable), the link function is chosen which is most suitable for the distribution. In the above equation, the parameters are chosen to maximize the likelihood of observing the sample values instead of minimizing the sum of squared errors (such as linear regression).
Logistic functions are used in the logistic regression to identify how the probability P of an event is affected by one or more dependent variables.
Key Differences Between Linear and Logistic Regression
- The Linear regression models data using continuous numeric value. As against, logistic regression models the data in the binary values.
- Linear regression requires to establish the linear relationship among dependent and independent variable whereas it is not necessary for logistic regression.
- In the linear regression, the independent variable can be correlated with each other. On the contrary, in the logistic regression, the variable must not be correlated with each other.
Conclusion
Linear regression models data using a straight line where a random variable, Y(response variable) is modelled as a linear function of another random variable, X (predictor variable). On the other hand, the logistic regression models the probability of the events in bivariate which are essentially occurring as a linear function of a set of dependent variables.
himanshu jain says
Informative article.
Paul says
Very useful and detailed content.
Rick says
I was a little confused before, but now it is clear to me.
Vinayaka Hegde says
Informative article. Thank you so much!
saiyashasvi gogula says
great and clear explanation
BABITHA E K says
Mam,
I am doing PhD -POSTPARTUM DEPRESSIVE SYMPTOMS(PPDS) AMONG MOTHERS-PREVALENCE AND RISK FACTORS. To identify the risk factors I have to do a regression analysis ,please help me to choose correct regression analysis for my study and also help me how to do it with SPSS software
for eg: i have categorized PPDS into 2 – present and absent based on the score
now i have to identify the risk of PPDS in relation to occupation, which is classified as five categories-homemaker, manual labour, private sector, govt sector, self-employed. Please help me looking forward to your favourable response.
Ainuddin Ansari says
Very Very helpful data…
Thanks, a lot…
Cham ojulu says
Thank you it’s very clear now than before!
M R Naik says
Nicely explained
Ana Carol says
Thank you for creating this comprehensive comparison chart! It effectively highlights the key differences and similarities between the various regression models, making it easier to grasp the nuances of each method. This visual representation is an invaluable resource for both beginners and experienced analysts, enabling them to make well-informed decisions when choosing the most appropriate regression technique for their data analysis. Great work!